Weather
This is a work in progress - Please don't take it seriously until it's
finished. I've already fixed two errors.
I thought I ought to write something about weather because, as I researched
things a bit for diving and now hang gliding, it is something I need to know
about.
What I discovered is that most things that people want to tell you about
weather just don't help. They tell you what they think you ought to know and
miss out the 'what on earth is happening' bit that I for one need at the
beginning.
So I'm going to start at the beginning and ramble round the subject. The scale
of things is the important factor.
Let us start with a statement:
"We are all used to air, sunlight and water so we already
know about weather from its basic components."
This is so wrong in so many ways it is frightening.
We know about air? Weightless stuff isn't it? Looking at a weather map today I
can see a small block of cold air moving south across England. It is small
because it's only about the size of Wales so, say 240 kilometres square and
about 20 kilometres thick. Air weighs about 1.27gms/litre so that's 1152
thousand cubic kilometres, 11e5 (11 with 5 zeros after it) cubic kilometres,
that's 11e14 cubic meters, 11e17 litres, OK I have to factor that by 70% as it
gets thinner on its way up to 20 kilometres high, so about 1e18 grams, 1e15
kilograms, 1e12 tonnes. Write 1e12 out properly as a one million million
tonnes. It probably has several million tonnes of water in those clouds too.
Believe me that is just a small weather system.
And solar powered... Well this isn't like the flat panel you bought on EBay
that lies on your car dashboard and totally fails to charge your car battery,
that is a few inches square. This is the size of Wales again. 240 by 240
kilometres (57e3) and remember that for the atmosphere there is no such thing
as a cloudy day as it is on top. The sun puts about 1.3Kw/square meter into the
upper atmosphere but about 30% bounces straight off and up in England we don't
have the sun beating straight down on us so factor out another 25% but even so
600watts per square meter is not bad when we have 57e9 square meters. That is
3.4e13 watts which is over one fifth of the entire Earth's population's
appetite of electricity which is 16e13 watts. This is just driving one small
weather system.
Right. Now you are getting a feel for things and I haven't even come to water
yet. We have one more snag. If I take a room with a curtain down the middle and
then I put cold air on one side and hot air on the other and then draw back the
curtain we very rapidly have a reasonably evenly warm room. For ten feet style
distances this works well but once we start talking in terms of the distances
we use in geography air masses do not mix. The edges might fuzz out a bit but
the rule is that the distinctions tend to persist until the temperatures even
out.
OK so now you're beginning to see why a good tropical storm, real climate
rather than the wimpy little weather we get in the UK, can convert you holiday
sun destination into a disaster movie set in a couple of hours. A few million
million tons of weather does what it wants to and we can make use of it or keep
out of its way.
So what are the rules so we can understand the monster?
Well the first, very important, rule is that cold air sinks. When air becomes
colder it becomes more dense. OK so it's only a fraction of a percent more
dense but when you have millions of millions of tons of the stuff small
fractions still work out as really big numbers. If some air is colder than
other air it is going down and somewhere else air that is warmer is going
up.
Once air is moving the very scale of the size of weather systems means that
they cover a lot of planet and the turning of the planet turns them. We tend to
think of the Earth rotating evenly but we all know the equator is rushing
eastwards at about 1670mph (a bit over twice the speed of sound) while the
poles are doing a pirouette going nowhere. Think of a block of air moving north
in the northern hemisphere. It has a northerly component to its velocity but to
be going due north to our eyes as we stand on the moving planet beneath it must
have an easterly component too to keep up with us. We know it weighs millions
of millions of tons and it's not bolted down or on rails so if the surface of
the earth chooses not to be moving so fast below it as it gets further north it
will just keep going and the easterly component starts to be seen. Similarly
air apparently going due south will not have so much easterly component and as
it comes south the increasing speed of the earth below it will make it
apparently start to move west. What does this add up to? Well air that would
have flowed straight into a low pressure area from all sides turns east when
coming from the south and west when coming from the north so it spirals in
anti-clockwise. In the southern hemisphere stand the whole argument on its head
and air spirals into a low clockwise.
(Trying to extrapolate this to why the bath water goes down the plug hole
clockwise or anticlockwise is a waste of time unless your bath is the size of
the North Sea and the plug hole is about as big as Birmingham. Small fractions
of less than nothing are very very small numbers.)
 Right. Now we are getting the picture. We have blocks of warmer and colder air.
They rotate and rise and fall and the borders between them tend to persist. Now
we can look at a weather map and start to make some sense of it.
Right. Now we are getting the picture. We have blocks of warmer and colder air.
They rotate and rise and fall and the borders between them tend to persist. Now
we can look at a weather map and start to make some sense of it.
First spot the map underneath with its lines of latitude and longitude. It's a
bit twisted because I've selected Europe and omitted the bulk of the
Atlantic. Germany is dead centre and England to the left of that a bit.
Now over that we have isobars. These are the light grey lines and some
have gaps in them with numbers in them. These are like the contour lines on a
map that track round at points of equal height so these track equal air
pressure. You can see they tend to run round places and the map makers
carefully mark the centres of each maximum or minimum with an X and a value
that is the pressure at that point. If the isobars are close together the
pressure will change rapidly if you travel across them.
The pressures on this map range from 969 to 1029 milliBars. I think the maximum
range ever recorded is 870 (Typhoon Tip 1979) to 1085.7 but those are serious
extremes. What you can see is that south of Iceland the pressure is changing
rapidly by distance (lots of close isobars) so there is lots of push generating
wind (air being pushed out of the high pressure area and heading for the low
pressure one) so it's windy in the Denmark Strait while out in the
Mediterranean there are virtually no isobars so the pressure is pretty constant
so the yotties are all becalmed and having a beer.
The darker lines with the lumps on them are the dividing lines between the
blocks of air. We talk about warm fronts and cold fronts but that just says
which way the divide is going. The triangles are a cold front (colder air
moving into an area that was previously occupied by warmer air) and the rounded
ones a warm front. Remember there aren't two different types of air, warm and
cold, so you can have successive cold fronts following one another, each air
mass colder than the one before it. Also in the tropics a 'cold' front may be a
transition from 'horribly hot' to merely 'uncomfortably hot'. It is just
cooler.
Now the guys drawing the maps try to put the blips on the fronts to show which
way they are moving and if it's stopped they alternate sides. Add the
complication that an old front can get so twisted up it is going in different
directions at different points along its length so at some places it is a warm
front and in others a cold front. Provided you remember that a front is just
the boundary between two different blocks of air characterised by temperature
it makes a lot more sense.
So just north of Ireland there is a nice warm front (round bits) with a cold
front (triangles) following it. The way things work normally means the cold
front will go faster and catch up. Now we probably still have a temperature
difference so there is still a front but all the weather that was associated
with the two fronts is now piled up on itself so we get an occluded front with
both symbols. Occluded fronts tend to start to fade out as they are confused.
The fronts to the west of Iceland are forming a nice new occluded front. The
one trailing down over Scandinavia still has a lot of weather in it but the one
that has drifted over to the Balkans and Turkey is coming to pieces and they
are drawing the symbols because there is some weather left but the temperature
difference has gone so it is now an ex-front.
There is a slight question about where is the warm air to the west of Ireland
going as the cold front catches up with the warm front and the answer is
actually pretty obvious. It is warm (lighter) air surrounded by cooler
(heavier) air so it goes up. When we discuss the three-dimensional shapes of
fronts this will make more sense.
Also air isn't strictly one temperature. A front can just end because the cold
air at that end was a bit warmer and the warm air a bit cooler and the
distinction went away. Don't expect a front line all the way round as the map
makers only put in the significant bits which to them is the bits with
weather in them.
So what are the lows and highs?
Well a centre of low pressure is just what we measure on the ground or a from
boat if it's out in mid-Atlantic like some of these. What is happening? Well
the air is warm and it is rising. This tends to leave less air behind so the
cooler air moves in to take its place. That's actually spiralling in as we
already discussed. Remember: Low pressure, rising air, anti-clockwise. If you
look at the front pattern on the mid-Atlantic low you can see how the
spiralling winds are already wrapping the fronts into curves.
A high pressure area is cooler air sinking and hence it is spiralling outwards,
this time clockwise. This gives us the simple trick that if you stand with your
back to the wind the high pressure is roughly on your right and the low on the
left. This falls apart when we start to consider local effects but it's a
handy rule of thumb and once you are well above the ground works well.
OK so that's air... What sort of weather does this cause?
Well by weather we are normally talking about water as clouds, as rain, as snow
and stuff or quite invisibly as water vapour.
 A few ground rules again: There is almost always water in the air but it is
called 'water vapour' and this is water in its gas state so you can't see it.
It's like sugar in your tea. Unless you're five and put in three big spoonfuls
there are no crystals left. Clouds are not water vapour. Only
when the water forms into droplets in its liquid state, even very small
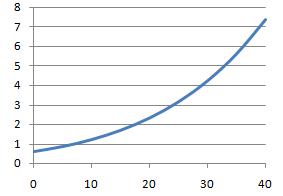
droplets does it appear. To put some numbers to that look at the graph on the
left. This is the partial pressure (think of it as a fraction) of water that
can exist in air as vapour at a given temperature. I've plotted from 0
to 40°C against 0 to 8kPa.
A few ground rules again: There is almost always water in the air but it is
called 'water vapour' and this is water in its gas state so you can't see it.
It's like sugar in your tea. Unless you're five and put in three big spoonfuls
there are no crystals left. Clouds are not water vapour. Only
when the water forms into droplets in its liquid state, even very small
droplets does it appear. To put some numbers to that look at the graph on the
left. This is the partial pressure (think of it as a fraction) of water that
can exist in air as vapour at a given temperature. I've plotted from 0
to 40°C against 0 to 8kPa.
 The first thing you notice is that warm air can hold a lot of this 'invisible',
gas state water so we can immediately deduce that as wet air cools it will
rapidly reach a point where the amount of water it contains exceeds its new
carrying capacity and it stops being water vapour and becomes plain ordinary
water as droplets. Store this fact in your mind with the label 'Dew Point'. For
any lump of air with water vapour in it the Dew Point is the temperature where
some of it stops being water vapour and starts to become ordinary, honest to
goodness water. It may be the dew on your lawn or the cloud you exhale on a
frosty day but it is the tiny droplets of water that you see.
The first thing you notice is that warm air can hold a lot of this 'invisible',
gas state water so we can immediately deduce that as wet air cools it will
rapidly reach a point where the amount of water it contains exceeds its new
carrying capacity and it stops being water vapour and becomes plain ordinary
water as droplets. Store this fact in your mind with the label 'Dew Point'. For
any lump of air with water vapour in it the Dew Point is the temperature where
some of it stops being water vapour and starts to become ordinary, honest to
goodness water. It may be the dew on your lawn or the cloud you exhale on a
frosty day but it is the tiny droplets of water that you see.
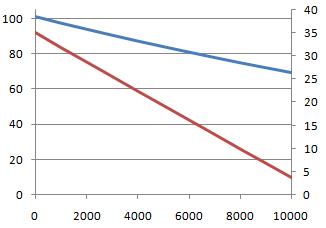
Move to the second graph on the right. Take some air, starting at 35°C and
make it just rise without any heat going in or out. The blue line is the
pressure, starting at the usual 101.3KPa (1013mBar) and falling as we go up to
10000 feet to 70kPa (see the scale on the left hand side). The red line is the
temperature scaled on the right. As the air expands its temperature drops. It
started at 35°C which is a nice hot day but by the time it has got up to
10000 feet it was down to 4°C. Put the two graphs together and you can see
why air with invisible vapour in it at ground level is releasing water droplets
and becoming a cloud as it rises. Please remember that this is not warm
damp air mixing with colder air as it rises, this is just the simple physics of
reducing the pressure. As we have already discussed air bodies tend not to
mix.
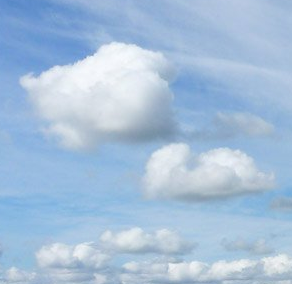 What I have here is a nice picture of a Cumulus cloud sitting on top of a
thermal. A thermal is warm air rising through the air above and, naturally,
getting colder as it does so. This means that at some point it is going to hit
its dew point and start dumping water vapour into droplets and become
visible.
What I have here is a nice picture of a Cumulus cloud sitting on top of a
thermal. A thermal is warm air rising through the air above and, naturally,
getting colder as it does so. This means that at some point it is going to hit
its dew point and start dumping water vapour into droplets and become
visible.
On a nice sunny day you often get lots of these little bubbles that appear from
nowhere and, once the hot spot that spawned the thermal ceases to drive things,
they fade away again. They tend to be known in old folk terms as 'fair weather
clouds' in that they didn't imply it was going to be windy or rain.
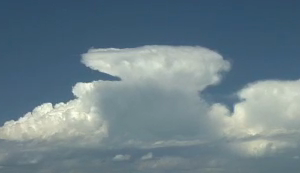 If they are big butch Cumulus they don't only create a bit of fluffy cloud but
it gets wet enough up there to start dropping water on your head. Clouds that
big tend to look dark because they are thick enough to stop the sun getting
through and we call them Cumulo-Nimbus. Nimbus is just a Meteorologist word for
'this one's gonna rain on you'. The big version of Cumulo-Nimbus is a
thunderstorm. The rising air is rushing up so lots of rain and some novel
electrostatics. This is little more than making sparks by pulling your nylon
jumper over your head and making crackling noises (try it in a blacked out
room) except on geographical distance scales again. Cu-Nims tend to have a flat
top as the rising air just runs out of rise and spreads out at some level or
runs into high altitude winds that give it the 'anvil' look.
If they are big butch Cumulus they don't only create a bit of fluffy cloud but
it gets wet enough up there to start dropping water on your head. Clouds that
big tend to look dark because they are thick enough to stop the sun getting
through and we call them Cumulo-Nimbus. Nimbus is just a Meteorologist word for
'this one's gonna rain on you'. The big version of Cumulo-Nimbus is a
thunderstorm. The rising air is rushing up so lots of rain and some novel
electrostatics. This is little more than making sparks by pulling your nylon
jumper over your head and making crackling noises (try it in a blacked out
room) except on geographical distance scales again. Cu-Nims tend to have a flat
top as the rising air just runs out of rise and spreads out at some level or
runs into high altitude winds that give it the 'anvil' look.
Big Cu-Nims are not nice clouds. They contain a lot of energy and viscous
updrafts so large aeroplanes like to steer well clear of them and hobby fliers
look at the sky and decide to stay home and mow the lawn before it rains. It
would be quite easy to find updrafts below one of these that not only would
outrun the sink rate of your glider but even that of your emergency
parachute.
Right now a point about air rising...
For air to rise it needs to be
lighter than the air it displaces. We have worked out that big lumps of air are
heavy but that goes for all air. A few hundred tons of air coming across the
countryside (wind) running into a few more hundred tons of air not going
anywhere stops. You will see simplistic drawings in books of air running in and
hitting a hillside and flowing up and over it. Well it has to be warmer air to
do this because if it is cooler and hence heavier it won't overflow the hill
any more than the incoming tide in the English Channel overflows Brighton. It
just fills up to its level and stops.
This can mean that you stand on the top of a hill on a chilly morning looking
out over a cool misty valley with a breeze blowing in your face and the mist is
just sitting there. Obviously no ridge lift. The valley before you is just a
still pool of colder air and the wind in your face is blowing across the top of
it.
Perhaps best way to put it is that Wind doesn't make air move, Wind is
air moving. Thinking of wind pushing air is such an easy trap to fall
into and it's just so horribly wrong.
Let's look at a Cold Front in a bit more detail.
 This is cold air moving into an area that was once warm air. Since the cold air
tends to sink relative to the warm air it tends to pile up and push along the
ground.
This is cold air moving into an area that was once warm air. Since the cold air
tends to sink relative to the warm air it tends to pile up and push along the
ground.
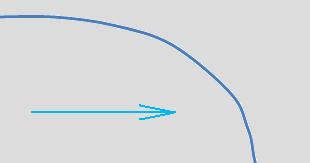
Please excuse the scrappy sketch. This is roughly what it looks like in
section. Think of a rounded bulldozer blade scraping along the ground lifting
the warmer air in front of it up and displacing it. OK, we know what rising air
means. The warmer air probably has a reasonable content of invisible water
vapour and suddenly it gets pushed up so the water vapour finds itself being
chucked out as droplets so all the way along the front we have lots of newly
generated clouds. Showers if you're lucky and thunderstorms if you aren't. This
is aggressive weather because it is so abrupt. As the warm air is being lifted
away the ground level pressure tends to decrease as the front approaches, hits
a low when it arrives and then increases as all that dense cold air sits on top
of you.
You can see these things coming. It's a wall of nasty, probably black, clouds
stomping across the countryside and when it gets to you it not only rains on
you but it is also colder and on the front itself are gusty winds. After it has
past it is a gloomy day as all your nice warm air has been lifted away and is
now a roof of cloud over the colder block. Places that have serious climate get
violent upsets at this point and tornado watchers chase cold fronts hopefully,
expecting a show.
I'll get a picture later.
And now a warm front.
This is a very different scenario. Because the warm air tends to rise in the
presence of colder air the encroaching warmer air tends to ride over the cold
air and generally squash it out of the way. The slope of the boundary is not
something I can draw as it is 1 in 100 or 1 in 200 (a hundred miles
horizontally for one mile vertically) so you aren't getting a picture as it
will just mislead you (lots of books draw something that looks about 1 in 4).
If I drew it to scale all the way across your 1000 pixel monitor it would rise
5 to 10 pixels, about the height of a letter o. It would be a very boring
drawing.
With a slope like that you start getting the effects of the incoming warm front
high above you when the actual ground level transition is still over 500 miles
away with Cirrus clouds at 26,000 feet ie. 5 miles high (remember the 100 to 1
slope). Then as it gets nearer you get lower and lower clouds. I'll do cloud
names later and try and explain why we care about the differences. However the
long 'overlap' isn't new rising air so the clouds tend to be reasonably
consistent. Frankly a warm, or occluded, front coming in is just a gloomy day
but usually dry.
Now that funny Occluded front thing
Now you know how a warm front's weather is spaced out in front of the front and
a cold front's is following it you can understand how, when the ground level
effects of a cold front catch up with the ground level effects of a warm front,
both sorts of weather persist. There is still a long run of warm air stretching
for hundreds of miles in front and a wall of cold air now up behind it so you
get the effects of both sort of weather.
Actually as warm fronts aren't anything like as good at pushing other air
masses out of the way cold fronts tend to catch up with them and the occluded
effect is pretty normal. High altitude cloud followed by a wall of the wet
stuff.
Thinking vertically
Right. Look back at my graph of temperature verses pressure as altitude. The
formula to work this out is a cool application of the first law of
thermodynamics but those lines look suspiciously straight.
We call this the Dry Adiabatic Lapse Rate. Dry as in air with no free water in
it so not cloud or mist. It works out at 9.76°C/kilometer or
3°C/thousand feet.
Once the air has free water in it it stops being a straight line. It is
horribly temperature dependant because as water transitions from vapour to
droplets it give up its latent heat of vaporisation but what the heck - a good
enough guess is 5°C/kilometer or 1.3°C/thousand feet. This is the
Saturated Adiabatic Lapse Rate. 1.3°C is wrong but it will do.
Just be clear now. This does not tell you how the temperature
drops with altitude. This tells you what would happen to a piece of air that
rises or falls without extra heat or water entering or leaving it. If you just
hang from a balloon and go up you are in different bits of air so the
temperature and humidity can do just whatever they want.
Also a 'Lapse Rate' is just the way something changes with altitude. We tend to
use it to talk about temperatures but the term can be used for anything. Don't
get caught out assuming...
Dew Point
So back to the other graph. The humidity verses temperature one. Again an
entertaining piece of maths can be simplified to the idea of a Dew Point. You
don't care what humidity is in grams of water per cubic meter of air you just
care when that piece of air is going to stop being clear air lapsing at 3°
per thousand and become cloud lapsing at 1.3° per thousand. This is the Dew
Point.
I love the term Dew Point. Somehow it conjures up images of an impeccably
dressed Victorian amateur Scientist wandering out into his garden on a misty
morning, watching his lawn, his greenhouse and some big pots with warmer and
colder water inside them and meticulously recording temperatures in his
journal. The Dew Point is just that. For a given lump of air it is the
temperature at which dew begins to form. That is the 'is it now cold enough for
the air to no longer support all the water vapour it contains?' point.
 There are absolute measures of humidity and relative humidity but the dew point
is the number we want for weather calculations. You can measure the dew point
directly by having a wet thermometer. A wet thermometer is fed with water that
is evaporating from it, and hence cooling it, until it gets down to the dew
point when water can't evaporate any more so it doesn't get any cooler and it
just stays there. Read the dew point. OK you can't just let it sit there in its
own cloud of fug, you need to make sure the air about it is regularly changed
but dew point thermometers normally come with a handle so you can wave them
about (seriously!). If you want the relative humidity, effectively how much
water there is in the air on a scale of 1 to 100% where 100% is hitting dew
forming you take the temperature on a dry thermometer too and use the simple
approximation that for every 1°C difference in the dew point and dry bulb
temperatures, the relative humidity decreases by 5%, starting with RH=100% when
the dew point equals the dry bulb temperature.
There are absolute measures of humidity and relative humidity but the dew point
is the number we want for weather calculations. You can measure the dew point
directly by having a wet thermometer. A wet thermometer is fed with water that
is evaporating from it, and hence cooling it, until it gets down to the dew
point when water can't evaporate any more so it doesn't get any cooler and it
just stays there. Read the dew point. OK you can't just let it sit there in its
own cloud of fug, you need to make sure the air about it is regularly changed
but dew point thermometers normally come with a handle so you can wave them
about (seriously!). If you want the relative humidity, effectively how much
water there is in the air on a scale of 1 to 100% where 100% is hitting dew
forming you take the temperature on a dry thermometer too and use the simple
approximation that for every 1°C difference in the dew point and dry bulb
temperatures, the relative humidity decreases by 5%, starting with RH=100% when
the dew point equals the dry bulb temperature.
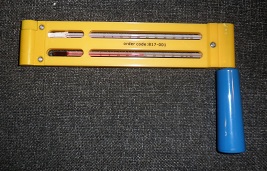
My picture is a device to do this. Two thermometers, one with a little cotton
sock on it fed with water from the bottle at the end and with a handle so you
can swing it round like an old rattle. They tend to come with a little chart so
you can convert the readings into relative humidity if that's the number you
want.
OK, so I just took it outside and did it. It took about 60 seconds of swinging
to get readings that weren't changing any more and it read 18°C(dry) and
13°C(wet) hence a 13°C dew point. The chart tells me that that is 49%
relative humidity. However if my 18°C garden was a hot spot and all my
neighbours were, for some reason, cooler then my nice warm air would start to
rise. With a 3°C per thousand feet lapse rate it would drop to 13°C at
about 1700 feet so I would have my own personal little cloud seventeen hundred
feet over my house sitting on a column of rising air.